freyja plot-covariants
Plot COVARIANTS output as a heatmap
freyja plot-covariants [OPTIONS] COVARIANTS
Options
- --output <output>
- Default:
covariants_plot.pdf
- --num_clusters <num_clusters>
number of clusters to plot (sorted by frequency)
- Default:
10
- --min_mutations <min_mutations>
minimum number of mutations in a cluster to be plotted
- Default:
2
- --nt_muts
if included, include nucleotide mutations in x-labels
- Default:
False
Arguments
- COVARIANTS
Required argument
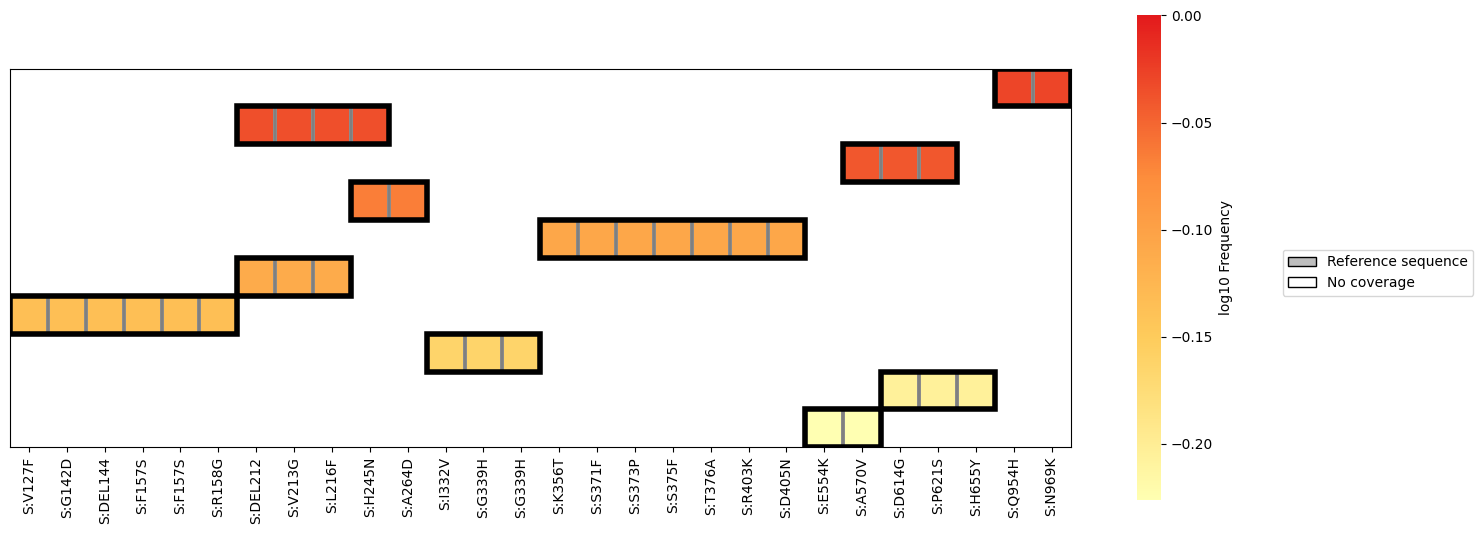
Example Usage:
This generates an informative heatmap visualization showing the
frequency and coverage ranges of each observed covariant pattern. --num_clusters sets the
number of patterns (i.e. rows in the plot) to display, while the
threshold --min_mutations sets a minimum number of mutations per set
of covariants for inclusion in the plot. The flag --nt_muts can be
included to provide nucleotide-specific information in the plot
(e.g. C22995A as opposed to S:T478K), making it possible to
view multi-nucleotide variants.
Example output: